
Supply chain system shock
The world has never been so volatile..or has it?

Last week, the Easter holiday closed out the first quarter of 2026, bringing to an end three turbulent months of geopolitical conflict that have affected millions of civilians and disrupted global supply chains.
The impact has been vast. Starting with tit for tat tariffs between the US and China, the expansion of “friendshoring” and culminating in the devastating war between the US, Israel and Iran and the separate but equally devastating Israeli attacks on Lebanon.
I’ve written previous articles on the crushing impact this is having on supply chains and the knock-on effects for the aid and food systems, but this week I was considering how significant these shocks were from a global historical basis, and can you even measure that?
Which events over the last 50 years delivered the biggest supply chain shocks
So, don’t hate me, but I used AI to prepare this list below. I never use AI to write this newsletter, but it would take hours to compile something like this myself, and I simply don’t have enough hours in the day. I haven't validated it, so at best we can consider it illustrative.
Generated by AI with the prompt - “give me one shock per year for the last 50 years that impacted global supply chains, be brief”
1976–1985
1976 – Aftershocks of the 1973 oil crisis continue to reshape global energy supply chains
1977 – Containerisation expands rapidly across global ports
1978 – Chinese economic reforms under Deng Xiaoping begin
1979 – Iranian Revolution disrupts global oil supply
1980 – Iran–Iraq War begins, impacting oil shipping
1981 – IBM launches the personal computer, accelerating electronics supply chains
1982 – Latin American debt crisis disrupts global trade flows
1983 – Introduction of GPS (military) begins future logistics transformation
1984 – Global semiconductor industry expansion accelerates
1985 – Plaza Accord reshapes manufacturing competitiveness
1986–1995
1986 – Chernobyl disaster disrupts European supply chains
1987 – Black Monday financial crash impacts global trade volumes
1988 – Exxon Valdez oil spill disrupts energy logistics in Alaska
1989 – Fall of the Berlin Wall opens Eastern European supply chains
1990 – Gulf War disrupts oil flows
1991 – Dissolution of the Soviet Union reshapes global trade routes
1992 – EU Single Market launched, reducing internal trade barriers
1993 – NAFTA signed, integrating North American supply chains
1994 – WTO established, formalising global trade rules
1995 – Commercial internet expands, enabling digital supply chains
1996–2005
1996 – Growth of global contract manufacturing (Asia-led) accelerates
1997 – Asian Financial Crisis disrupts manufacturing hubs
1998 – Russia financial crisis impacts the commodities supply
1999 – Y2K drives global IT and supply chain system upgrades
2000 – Dot-com crash impacts tech supply chains
2001 – September 11 attacks disrupt global aviation and trade
2002 – US port lockout disrupts West Coast supply chains
2003 – SARS outbreak disrupts Asian supply chains
2004 – Indian Ocean tsunami disrupts regional logistics
2005 – Hurricane Katrina disrupts US energy and logistics
2006–2015
2006 – Expansion of mega container ships reshapes shipping economics
2007 – Global food price crisis disrupts agricultural supply chains
2008 – Global Financial Crisis collapses trade volumes
2009 – H1N1 pandemic impacts global travel and logistics
2010 – Eyjafjallajökull eruption halts European air freight
2011 – Fukushima nuclear disaster disrupts electronics and automotive supply chains
2012 – US drought impacts global food supply chains
2013 – Rana Plaza factory collapse reshapes apparel sourcing
2014 – Russia annexes Crimea, triggering sanctions and trade shifts
2015 – Volkswagen emissions scandal disrupts automotive supply chains
2016–2025
2016 – Brexit referendum creates long-term trade uncertainty
2017 – US withdraws from TPP, reshaping Asia-Pacific trade alignment
2018 – US–China trade war begins with tariffs imposed
2019 – US–China tariffs escalate across multiple sectors
2020 – COVID-19 pandemic shuts down global supply chains
2021 – Suez Canal blockage by Ever Given halts global shipping route
2022 – Russian invasion of Ukraine disrupts energy, grain, fertiliser
2023 – Red Sea shipping disruptions begin due to attacks on vessels
2024 – Panama Canal drought restricts vessel transits
2025 – Escalation of the Middle East conflict disrupts Hormuz and regional logistics
So, how would you objectively compare these shocks to see which has the biggest impact, and which indicators would you use?
Measuring the “supply chain shock” factor
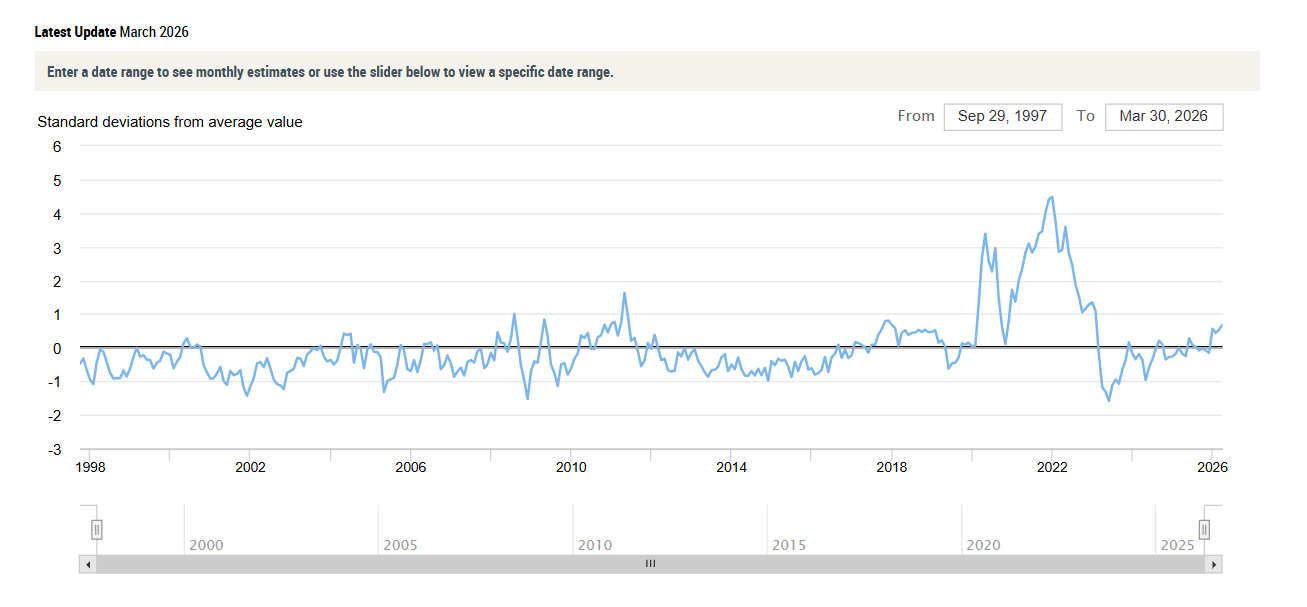
The first indicator I found to measure supply chain shock was the Global Supply Chain Pressure Index.
See below for the rationale behind this indicator and what it measures.
The goal behind constructing the Global Supply Chain Pressure Index (GSCPI) was to develop a parsimonious measure of global supply chain pressures that could be used to gauge the importance of supply constraints with respect to economic outcomes. Related research indicates, for example, that changes in the GSCPI are associated with goods and producer price inflation in the United States and the euro area, both during the pandemic period and stretching back to 1997 (the starting point of the dataset).
The GSCPI integrates a number of commonly used metrics with the aim of providing a comprehensive summary of potential supply chain disruptions. Global transportation costs are measured by employing data from the Baltic Dry Index (BDI) and the Harpex index, as well as airfreight cost indices from the U.S. Bureau of Labor Statistics. The GSCPI also uses several supply chain-related components from Purchasing Managers’ Index (PMI) surveys, focusing on manufacturing firms across seven interconnected economies: China, the euro area, Japan, South Korea, Taiwan, the United Kingdom, and the United States. For complete details on the data and methodology used to construct the GSCPI, see the foundational Staff Report.
Below you can see the indicator over the last twenty years or so, with the major spikes being the global financial crisis (2008), the Japan earthquake (2011) and the Covid pandemic (2020-2021).
The indicator has not yet been updated to reflect the impact of the latest war in the Middle East and how it compares to recent major shocks like Covid.
The second indicator was the Global Supply Chain Stress Index that comes from the World Bank. This one appears to be about container port challenges: measuring delays at the port level and aggregating them into an overall indicator expressed in millions of TEUs under stress.
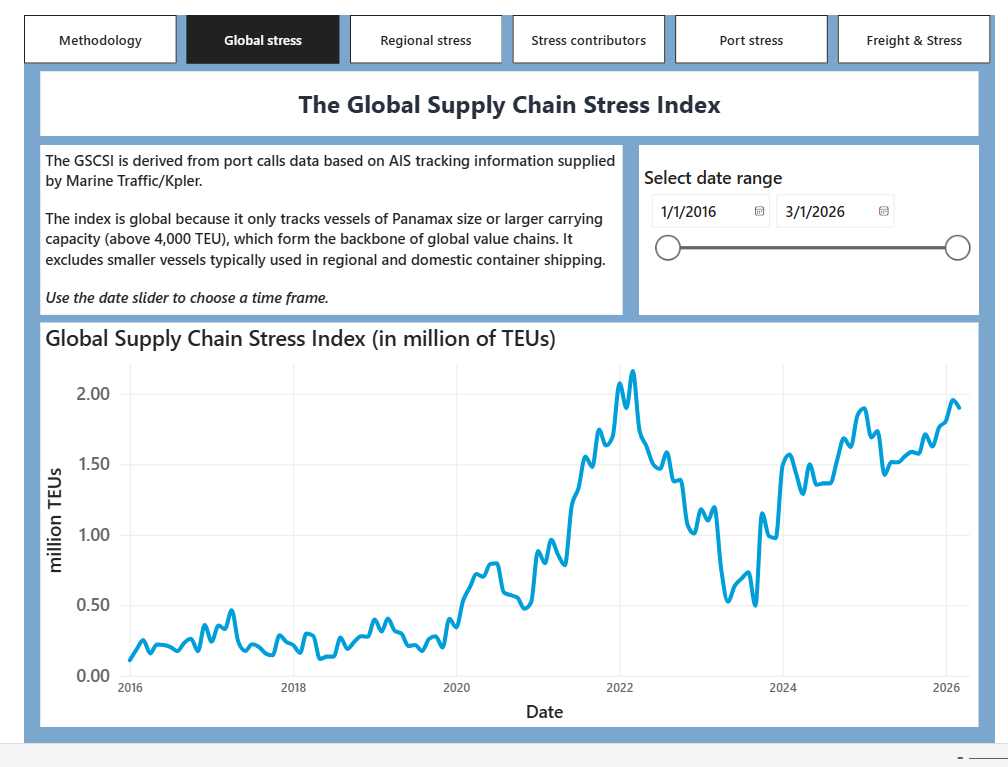
This data shows increasing turbulence since the start of COVID (2020), and with additional peaks most likely caused by tariff wars, showing through 2024-2026. This indicator was last updated in early March, so I would expect the trend to continue up when measured in April.
These two indices interpret underlying data to produce a global index that aims to compare relative shocks.
But actually, they probably aren’t that useful day to day for assessing supply chain stress and its impacts on a specific supply chain. No one runs a truly global supply chain; we are all exposed to different regions, lanes, modes, and at different times and in different years, so looking at more detailed, localised data is the way to understand how important shocks are.
Finding indices that track prices on lanes you are particularly exposed to, perhaps helps you to understand supply and demand on your particular lane, or tracking port congestion for your critical hubs or demand on your particular container routes. If you rely on commodities, then tracking the spot prices of those commodities may be your best route.
A shock to a single lane on which you are reliant and have no contingency can destroy your supply chain, but would not register on the charts above as globally significant.
So are we in the most turbulent of times globally?
According to the indicies then no, not even the most impactful in the 2020’s. I’m also sure that if you spoke to someone in 1919 or 1942, then the level of global turbulence today would seem relatively small compared to what the world was dealing with back then. The extent to which the current Middle East war disrupts global supply chains will depend on whether the ceasefire holds and, therefore, on developments in the Straits of Hormuz and the Bab El Mandeb. A prolonged war for months may lead to spikes that dwarf those seen in recent times.
I can’t end without repeating what I always say: you can’t measure impact purely in metrics, lead times, and supply chain disruptions. Millions of children globally are living under horrific conditions caused by conflicts that could be resolved. Whether in internal factional conflicts or regional or global conflicts, if we put people first and set our own desire for power aside, then it would be possible to build a better world.
I hope for an end to conflicts that impact millions of children around the world and a return to normality, where supply chain shocks affect only companies' bottom lines, not household budgets or children’s lives.